Car Model Accidents
30 September 2022 |
 Andy Moody
Which vehicles are the most likely to be involved in an accident?
Have you ever wondered which cars are the most accident-prone? And which cars keep you safest getting behind the wheel?
We analysed crash statistics from the Department for Transport and the National Highway Traffic Safety Administration to find which cars crashed the most during 2020.
A crash can involve any make and model of car, and with temporary car insurance, you’re usually covered up to the vehicle’s market value if you have to make a claim.
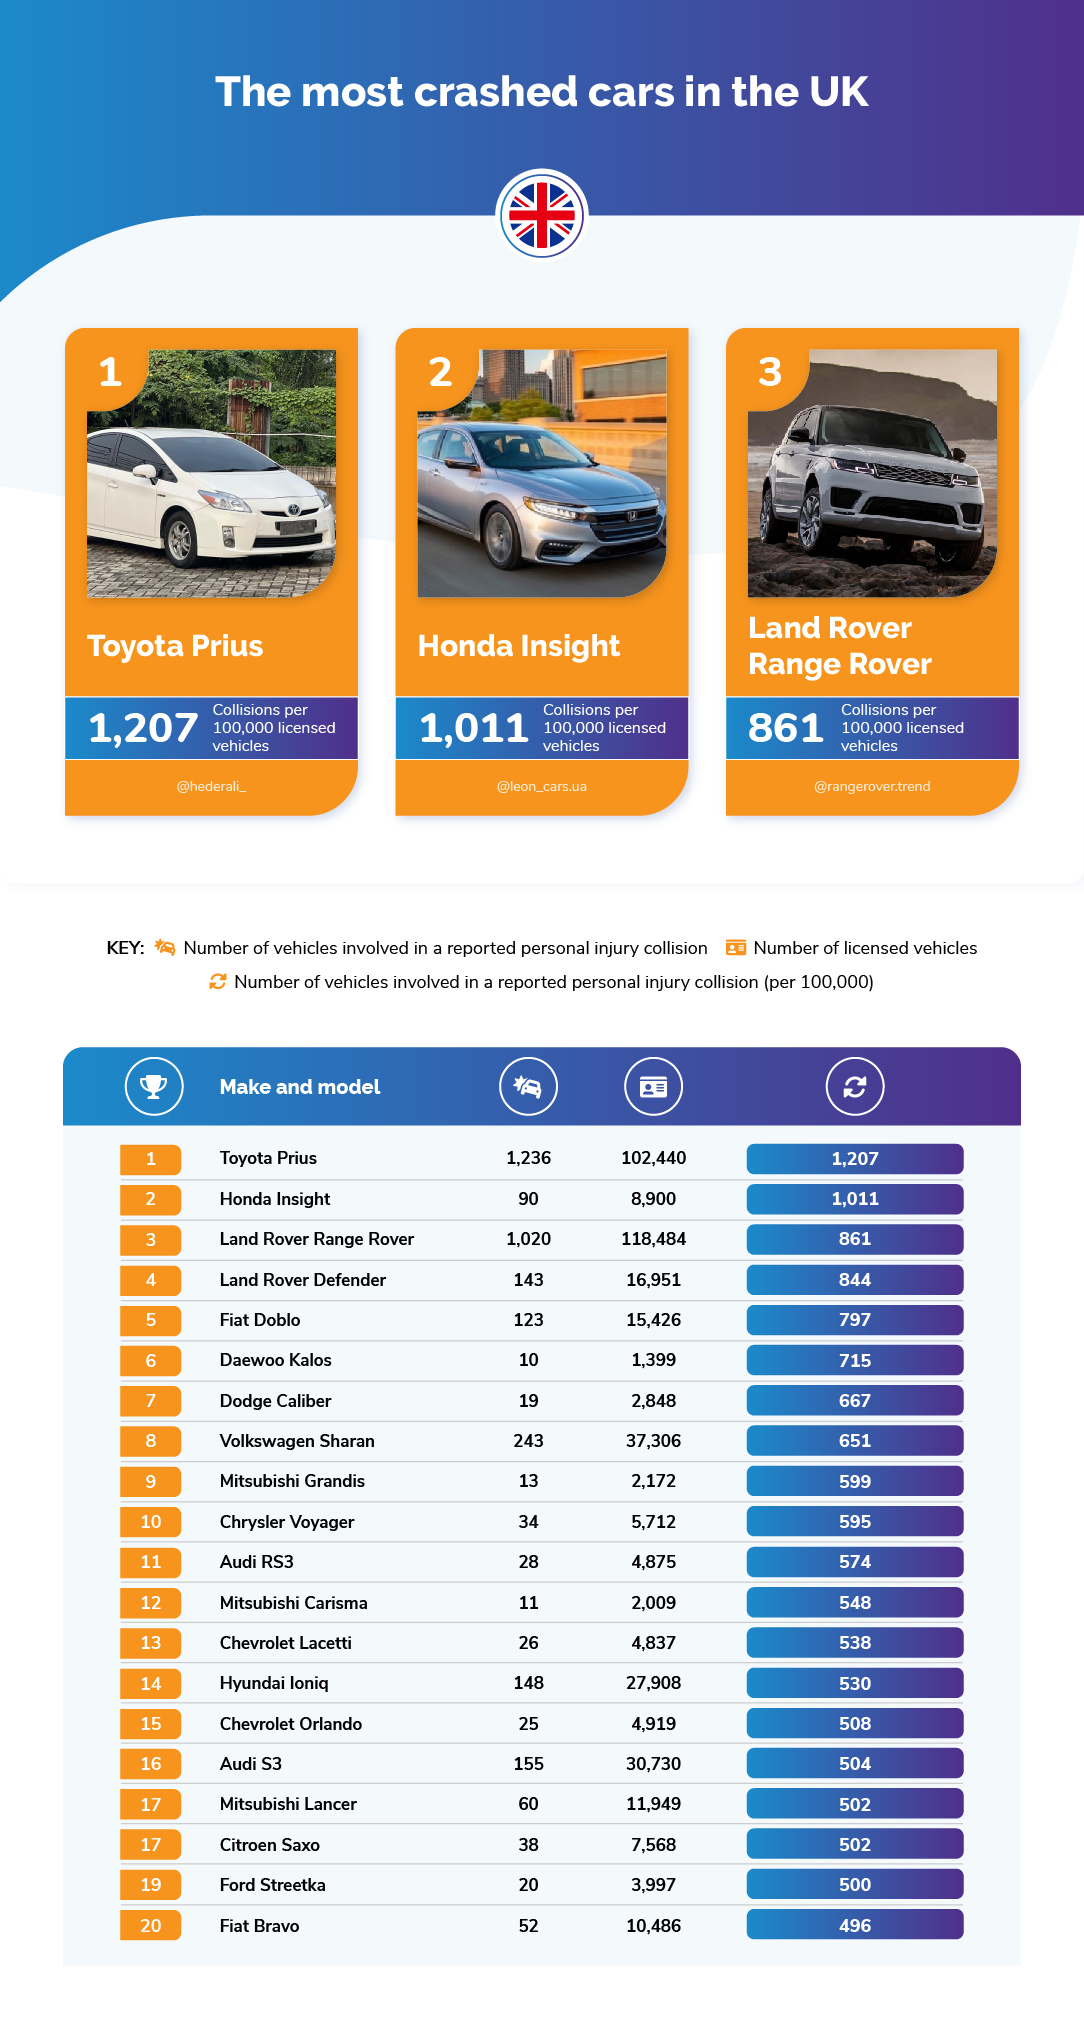
- Toyota Prius: 1,207 collisions per 100,000
In first place, the most likely to crash vehicle in the UK is the Toyota Prius, in terms of collisions per 100,000 licensed vehicles in 2020.
We found there were 1,236 Toyota Prius’ involved in a reported personal injury collision during the 2020 calendar year, and 102,440 licensed vehicles by the end of 2020, meaning there were 1,207 crashes per 100,000
- Honda Insight: 1,011 collisions per 100,000
The Honda Insight ranks in second place as one of the most crashed vehicles in the UK. Of all the vehicle collisions in 2020, we found that 90 were attributable to Honda Insights.
There were 8,900 licensed Insights by the end of 2020, meaning there were 1,011 Honda Insight crashes per 100,000.
- Land Rover Range Rover: 861 collisions per 100,000
The Land Rover Range Rover is one of the most likely vehicles to be involved in a crash in the UK. According to the Department for Transport, there were 118,484 Range Rovers licensed by the end of 2020, and there were 1,020 crashes during the calendar year.
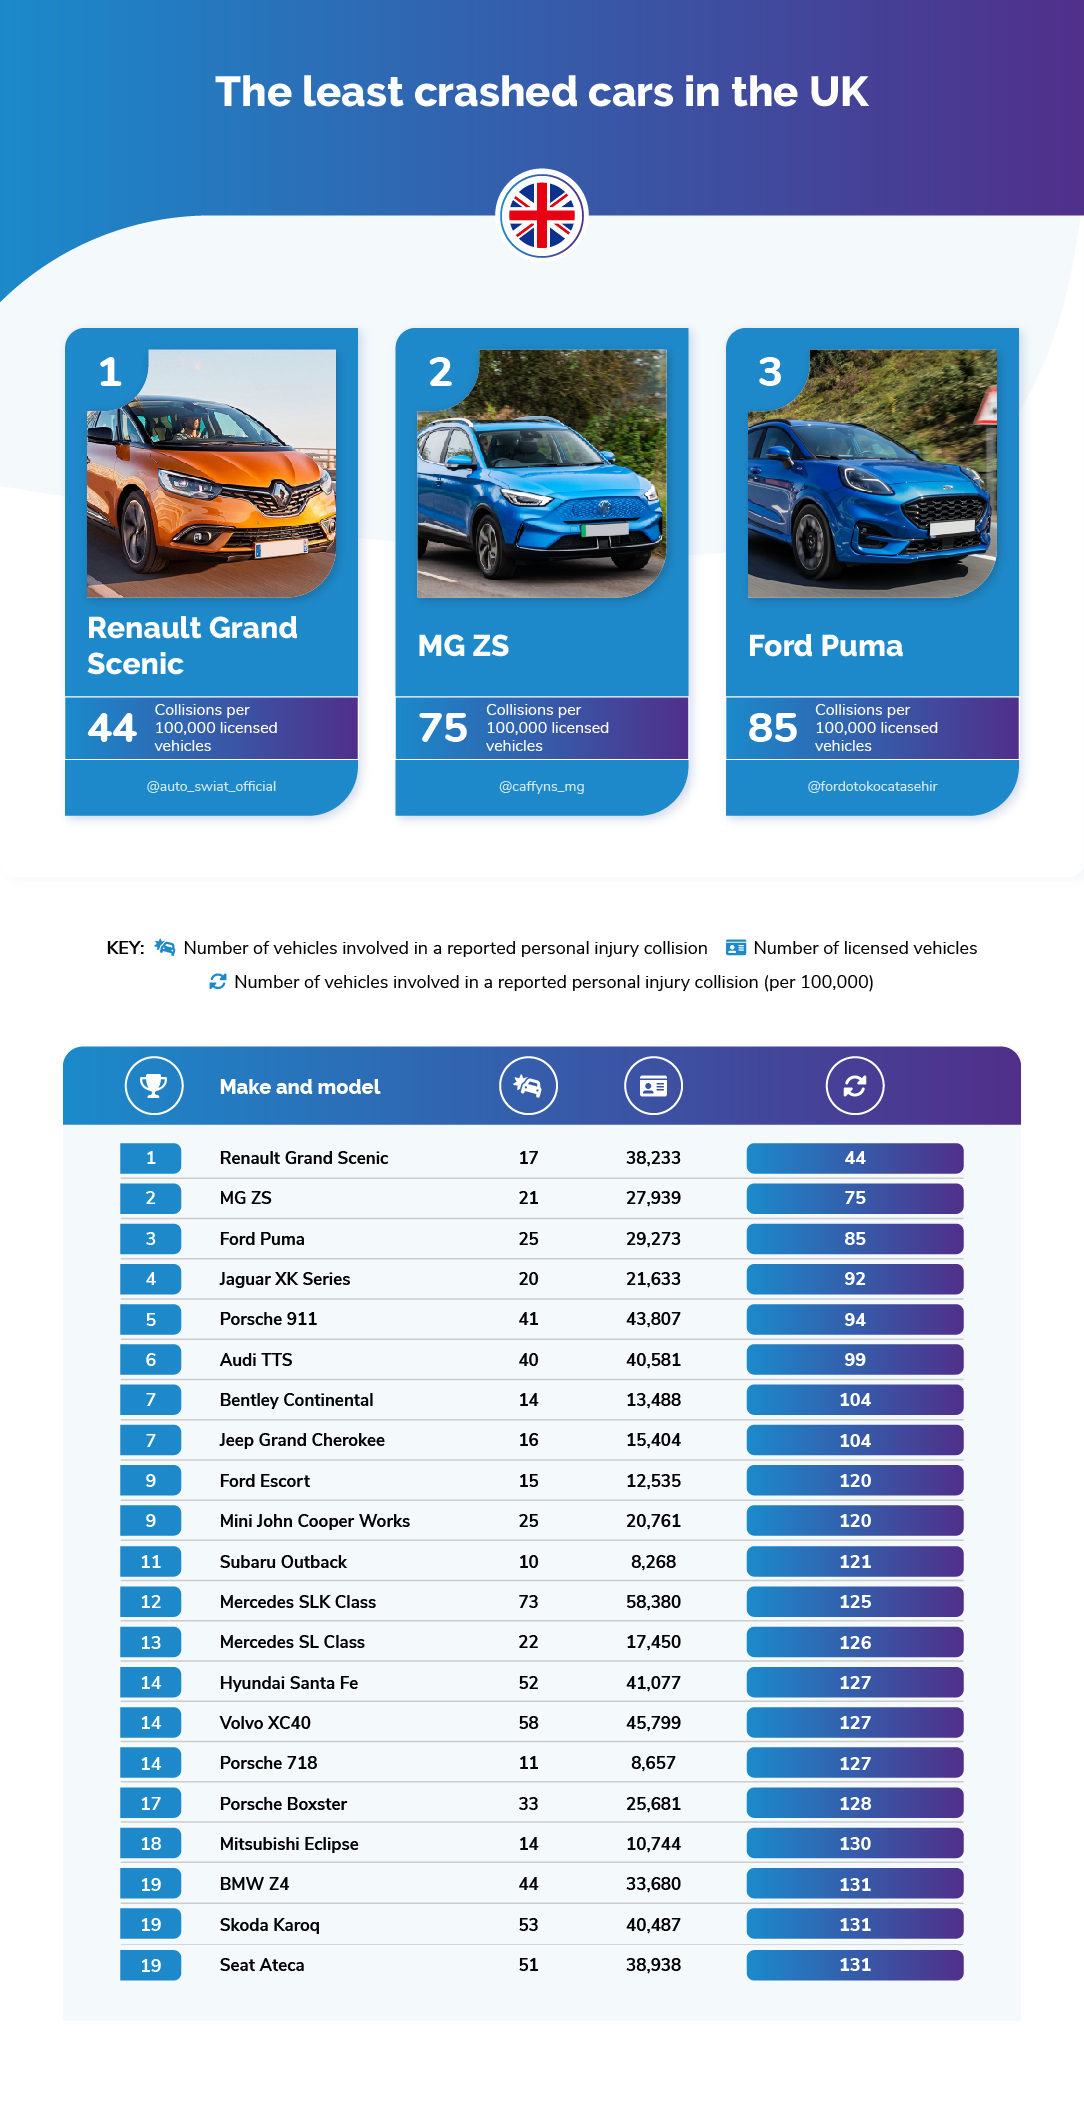
The Department for Transport excludes crash data for those makes and models where the number of crashes is fewer than 10. However, for those vehicle makes and models which were involved in 10 or more crashes during 2020, the models below were involved in the least crashes per 100,000 licensed vehicles, and are therefore the least likely vehicles to be involved in a crash in the UK.
- Renault Grand Scenic: 44 collisions per 100,000
The Renault Grand Scenic is the safest vehicle in terms of crashes per 100,000 licensed vehicles. There were 44 collisions of Renault Scenics in 2020 and there were 38,233 licensed vehicles by the end of the year.
- MG ZS: 75 collisions per 100,000
The MG ZS is among the safest vehicle models in the UK, with 75 collisions per 100,000 vehicles. We found that there were 21 crashes involving MG ZSs in 2020 and 27,939 licensed models.
- Ford Puma: 85 collisions per 100,000
The Ford Puma is one of the least likely vehicle models to be involved in a crash, with 85 collisions per 100,000 vehicles in 2020. There were 29,273 licensed Ford Pumas in 2020 and 25 were involved in a crash.
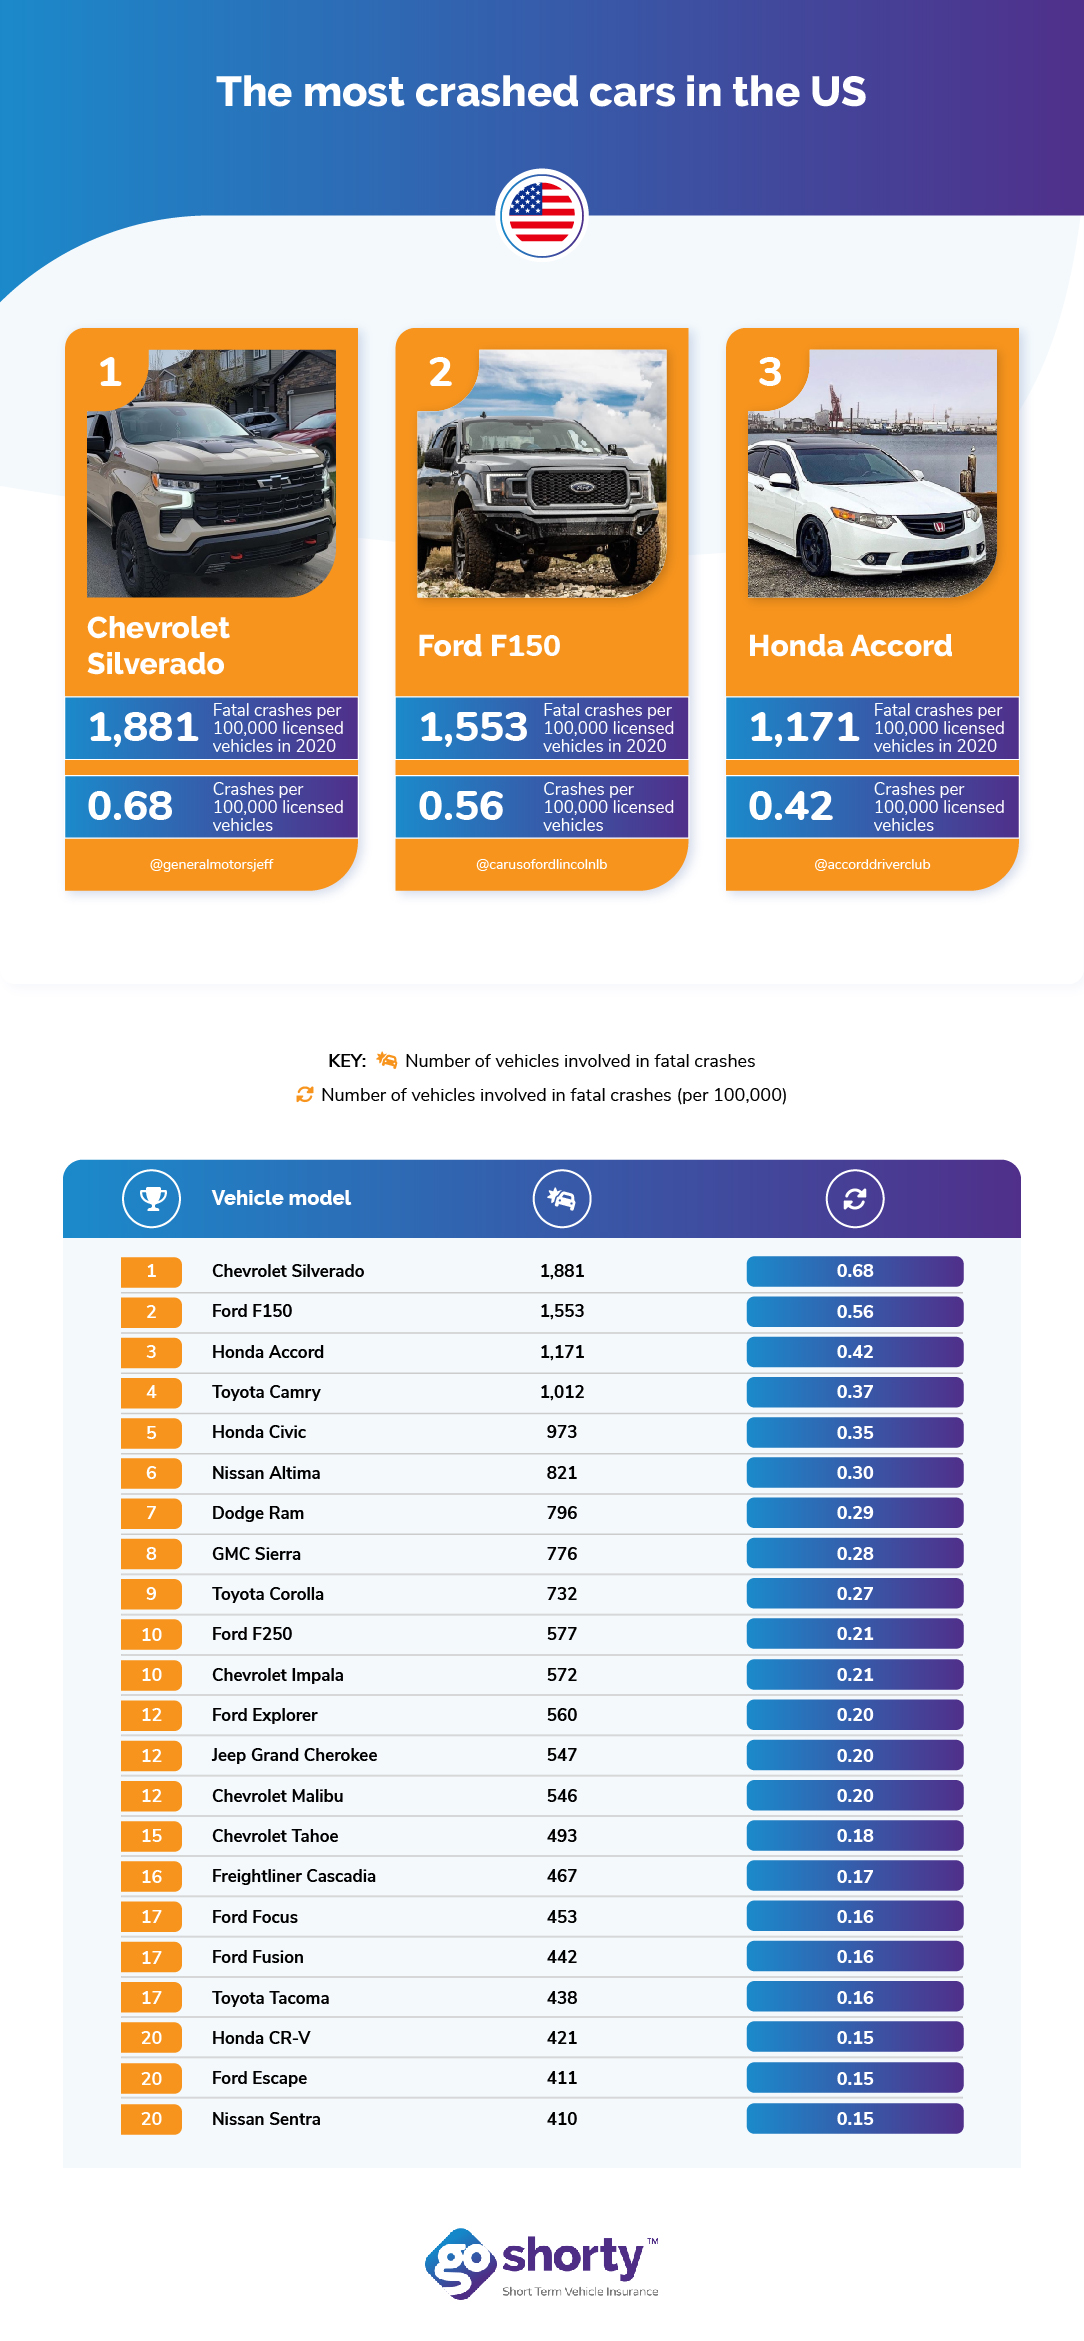
- Chevrolet Silverado: 1,881 fatal crashes in 2020 | 0.68 crashes per 100,000
In first place, the Chevrolet Silverado is the vehicle most likely to be involved in a fatal crash in the US
According to the National Highway Traffic Safety Administration, there were 1,881 fatal crashes of Chevrolet Silverados during 2020 or 0.68 crashes for every 100,000 licensed vehicles in the US.
- Ford F150: 1,553 fatal crashes in 2020 | 0.56 crashes per 100,000
In second place, the Ford F150 is one of the most crashed vehicles in the states, which is no surprise considering its popularity across the country.
In 2020 there were 1,553 fatal crashes of Ford F150s or 0.56 crashes per 100,000 licensed vehicles.
- Honda Accord: 1,171 fatal crashes in 2020 | 0.42 crashes per 100,000
The Honda Accord rounds out our top-three most crashed cars in the US. The Accord was involved in 1,171 fatal crashes in 2020, or 0.42 crashes for every 100,000 registered vehicles.
Methodology
We wanted to determine which cars you are most likely and least likely to be involved in a crash while driving. We looked only at car models, for example, we looked at the ‘Land Rover Range Rover’ and the ‘Land Rover Range Rover Evoque’ as separate car models. We classified cars by specific model, not by make or manufacturer.
We sourced the number of vehicle crashes by car make and model in 2020 in the UK from the Department for Transport Road accidents and safety statistics.
We sourced the number of licensed vehicles for each make and model during Q4 of 2020 from Vehicle licensing statistics. We only looked at car models with at least 10 licensed vehicles, and excluded motorcycles, heavy goods vehicles and other vehicles. We identified the number of vehicle crashes for each car model per 100,000 vehicles.
We sourced the number of vehicle crashes by car make and model in 2020 in the US from the National Highway Traffic Safety Administration (NHTSA) Motor Vehicle Crash Data Querying and Reporting.
We sourced the number of vehicles in the US from Statista.