Smart Motorways
20 October 2022 |
 Andy Moody
Are smart motorways safer and more effective at managing traffic?
Smart motorways have gradually been implemented across the UK in recent years, with three main types: controlled motorways, dynamic hard shoulder motorways and, more recently, all-lane running motorways. These motorways use speed cameras to regulate the speed limit and manage traffic flow, as well as gantry signs to indicate where lanes are closed due to breakdowns or collisions.
There have been many concerns about the effectiveness and safety of ALR (all-lane running) smart motorways. As the UK is shifting towards using these motorways, which would see the removal of the hard shoulder on motorways under this scheme there has been criticism and concern about the safety of ALR motorways. This has led to National Highways pausing all conversions of motorways to ALR schemes and further constructions of ALR schemes.
However, we at GoShorty, have looked into various motorway schemes to see which are the safest, least congested and largest, as well as public opinion on these schemes via a YouGov survey.
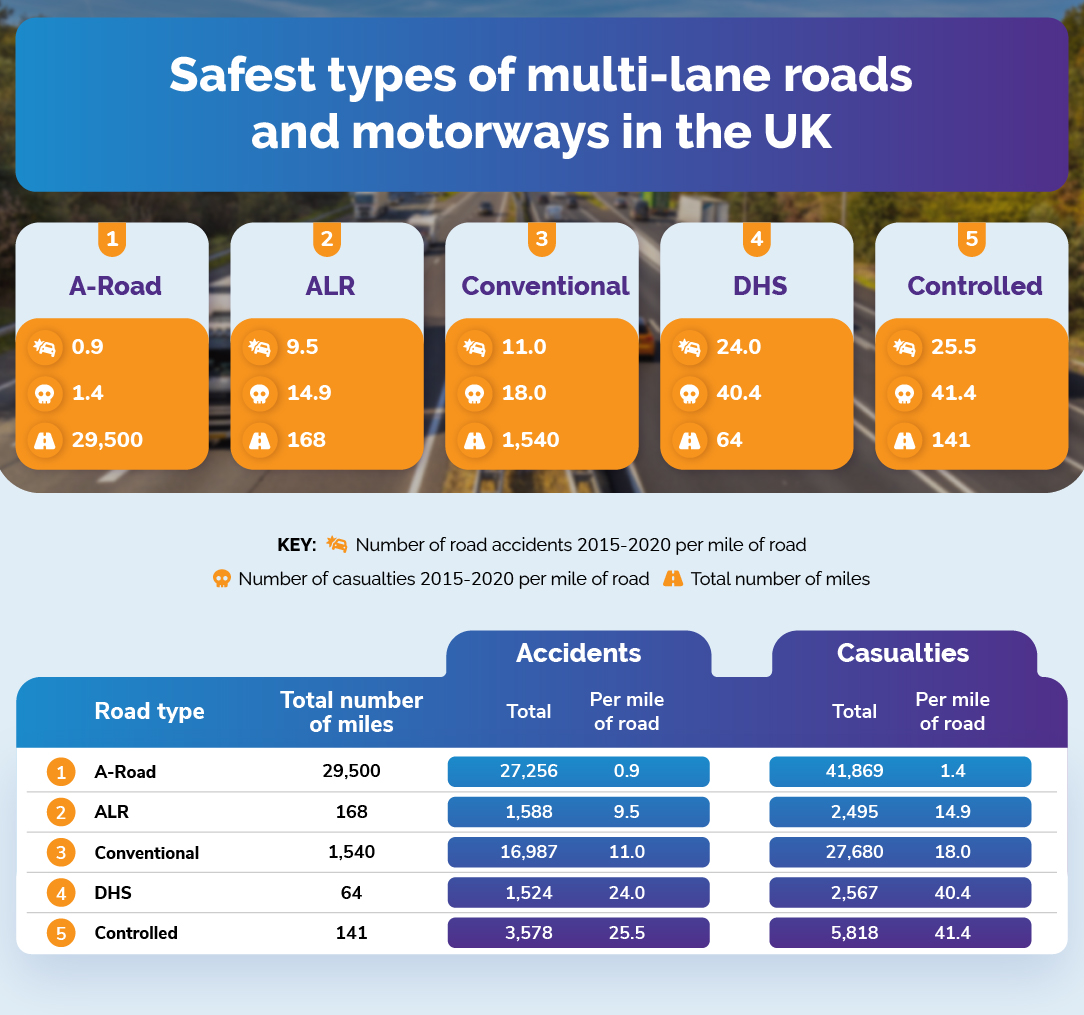
- A-Road
Number of Road Accidents 2015-2020 per Mile of Road: 0.9 | Number of Casualties 2015-2020 per Mile of Road: 1.4 | Total Number of Miles: 29,500
A-roads are rather similar to conventional motorways, in that they also feature two or three lanes, but they are also much narrower and less busy compared to a conventional motorway. There are no variable speed limits, instead, there is the flat 70 MPH national speed limit. According to the UK Government, there are 29,500 miles of A-road in the UK. And during 2015-2020 A-roads had 0.9 accidents per mile of road, leading to 1.4 casualties per mile, making it the safest among multi-lane roads and motorways in the UK.
- All-lane running (ALR)
Number of Road Accidents 2015-2020 per Mile of Road: 9.5 | Number of Casualties 2015-2020 per Mile of Road: 14.9 | Total Number of Miles: 168
Many DHS (Dynamic Hard Shoulder) schemes were in the process of being converted to ALR schemes, before being paused by National Highways (The UK Government’s agency that operates England’s motorways and major roads) due to safety concerns. This road is similar to DHS, but has removed the hard shoulder lane, making it a permanently running lane and implementing emergency spots for drivers to use if their vehicle is experiencing difficulties. A big leap up from A-roads, ALR motorways had 9.5 accidents per miles of road between 2015-2020 and 14.9 casualties.
- Conventional
Number of Road Accidents 2015-2020 per Mile of Road: 11.0 | Number of Casualties 2015-2020 per Mile of Road: 18.0 | Total Number of Miles: 1,540
Conventional motorways typically feature just three lanes and don’t often have variable speed limits, as well as fewer speed cameras. According to National Highways, there are 1,540 miles of conventional motorway in the UK and during 2015-2020 there were 11 accidents per mile on such roads, with 18 casualties per mile as consequence.
- Dynamic Hard Shoulder (DHS)
Number of Road Accidents 2015-2020 per Mile of Road: 24.0 | Number of Casualties 2015-2020 per Mile of Road: 40.4 | Total Number of Miles: 64
Dynamic Hard Shoulder schemes come out as one of the least safe motorways in the UK, statistically. They have a hard shoulder lane, which is separated from the normal carriageway by a solid white line and whether it is open to traffic is indicated by overhead gantry signs. They also use speed cameras to regulate the speed limit in an attempt to manage the flow of traffic. During 2015-2020 there were 24 accidents per mile of road on DHS motorways, with 40.4 casualties, making it the second least safe motorway type in the UK.
- Controlled
Number of Road Accidents 2015-2020 per Mile of Road: 25.5 | Number of Casualties 2015-2020 per Mile of Road: 41.4 | Total Number of Miles: 141
Controlled motorways have three or more lanes with variable speed limits, displayed on gantry signs and regulated by speed cameras. If the gantry shows no speed limits, then the national speed limit is in effect, which is 60 MPH for single carriageways and 70 MPH for dual carriageways. On these roads, the hard shoulder should only be used in a genuine emergency. With just a slightly higher accident rate compared to DHS motorways, controlled motorways had 25.5 accidents per mile of road between 2015 and 2020, with 41.1 casualties.
You can, however, ensure that you are further protected on more dangerous and accident-prone roads with our temporary car insurance, rated 4.8/5 stars on Trustpilot. Our temporary car insurance features a low excess cost and you can be covered from 1 hour up to 28 days with our fully comprehensive cover.
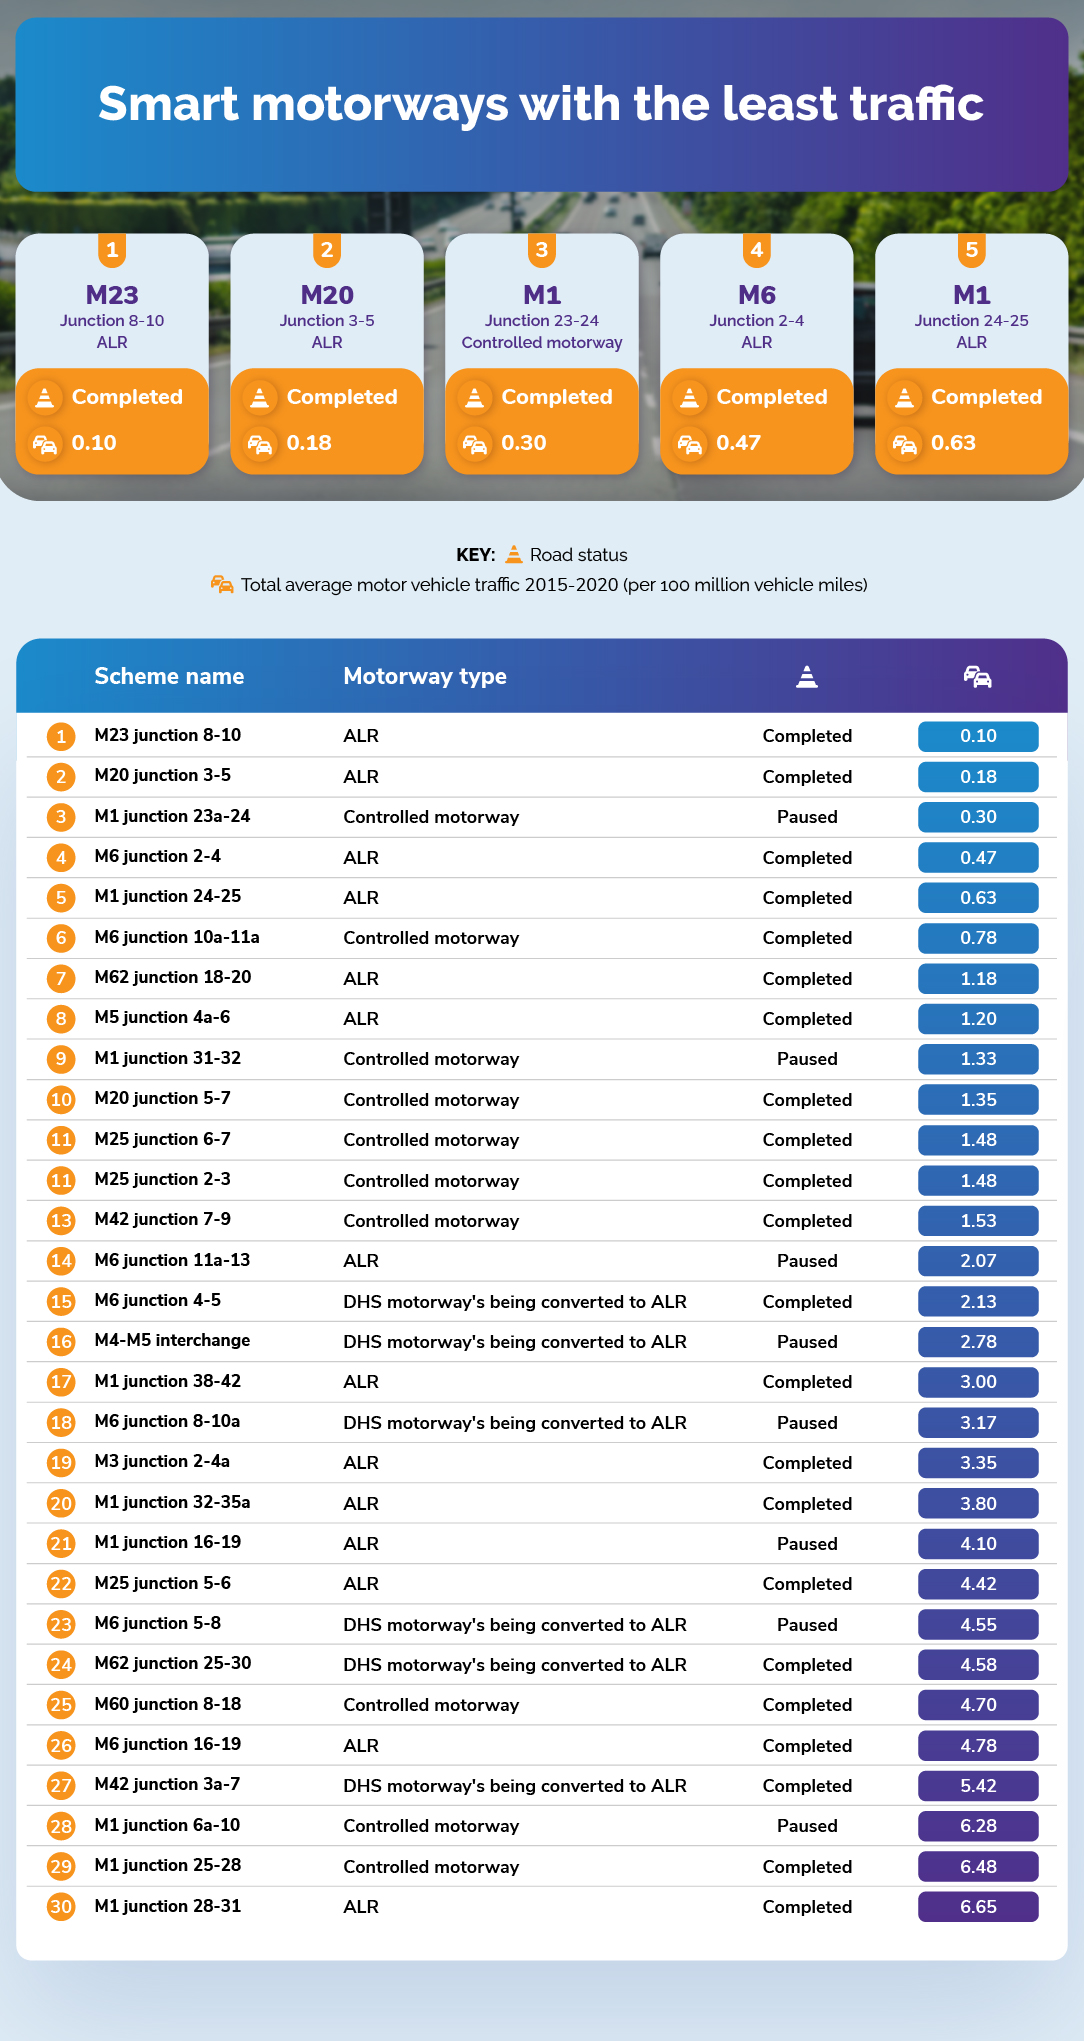
- M23 Junction 8-10 – ALR
Road Status: Completed | Total Average Motor Vehicle Traffic 2015-2020 (per 100 million vehicle miles): 0.1 vehicle miles
The M23 is a stretch of motorway in the UK, junctions 8 to 10 run from Merstham to Copthorne and is situated close to Gatwick Airport. It was upgraded to an ALR motorway between 2017-18 and it cost a total of £164 million, according to National Highways. It saw an average traffic rate of 0.1 vehicle miles per 100 million vehicle miles between 2015-2020, making it the motorway with the lowest traffic rate.
- M20 Junction 3-5 – ALR
Road Status: Completed | Total Average Motor Vehicle Traffic 2015-2020 (per 100 million vehicle miles): 0.18 vehicle miles
In July 2018, the Department for Transport upgraded a section of the M20, on junctions 3-5 to an ALR smart motorway with an emergency area every 1.21 miles, costing a total of £92 million. During 2015-2020, this strip of motorway recorded a traffic rate of 0.18 vehicle miles per 100 million vehicle miles, making it the motorway with the second lowest traffic rate.
- M1 Junction 23a-24 – Controlled Motorway
Road Status: Completed | Total Average Motor Vehicle Traffic 2015-2020 (per 100 million vehicle miles): 0.3 vehicle miles
The M1 junction 23a-24 is a controlled motorway, which is an older type of motorway still retaining the hard shoulder that ALR motorways now don’t have. During 2015-2020, this motorway stretch recorded a traffic rate of 0.3 vehicle miles per 100 million vehicle miles. This is the only non-ALR motorway within the top five of this ranking.
- M6 Junction 2-4 – ALR
Road Status: Completed | Total Average Motor Vehicle Traffic 2015-2020 (per 100 million vehicle miles): 0.47 vehicle miles
Early in 2018, work began to change the M6 junctions 2-4 into an ALR motorway with the road being opened to traffic in April of 2020. During 2015-2020, this stretch of motorway averaged a traffic rate of 0.47 vehicle miles per 100 million vehicle miles.
- M1 Junction 24-25 – ALR
Road Status: Completed | Total Average Motor Vehicle Traffic 2015-2020 (per 100 million vehicle miles): 0.63 vehicle milesAnd finally, another ALR motorway, the M1 junction 24-25 was opened to traffic in February 2019, making it one of the newest smart motorways on the M1. During 2015-2020, this junction recorded an average traffic rate of 0.63 vehicle miles per 100 million vehicle miles.
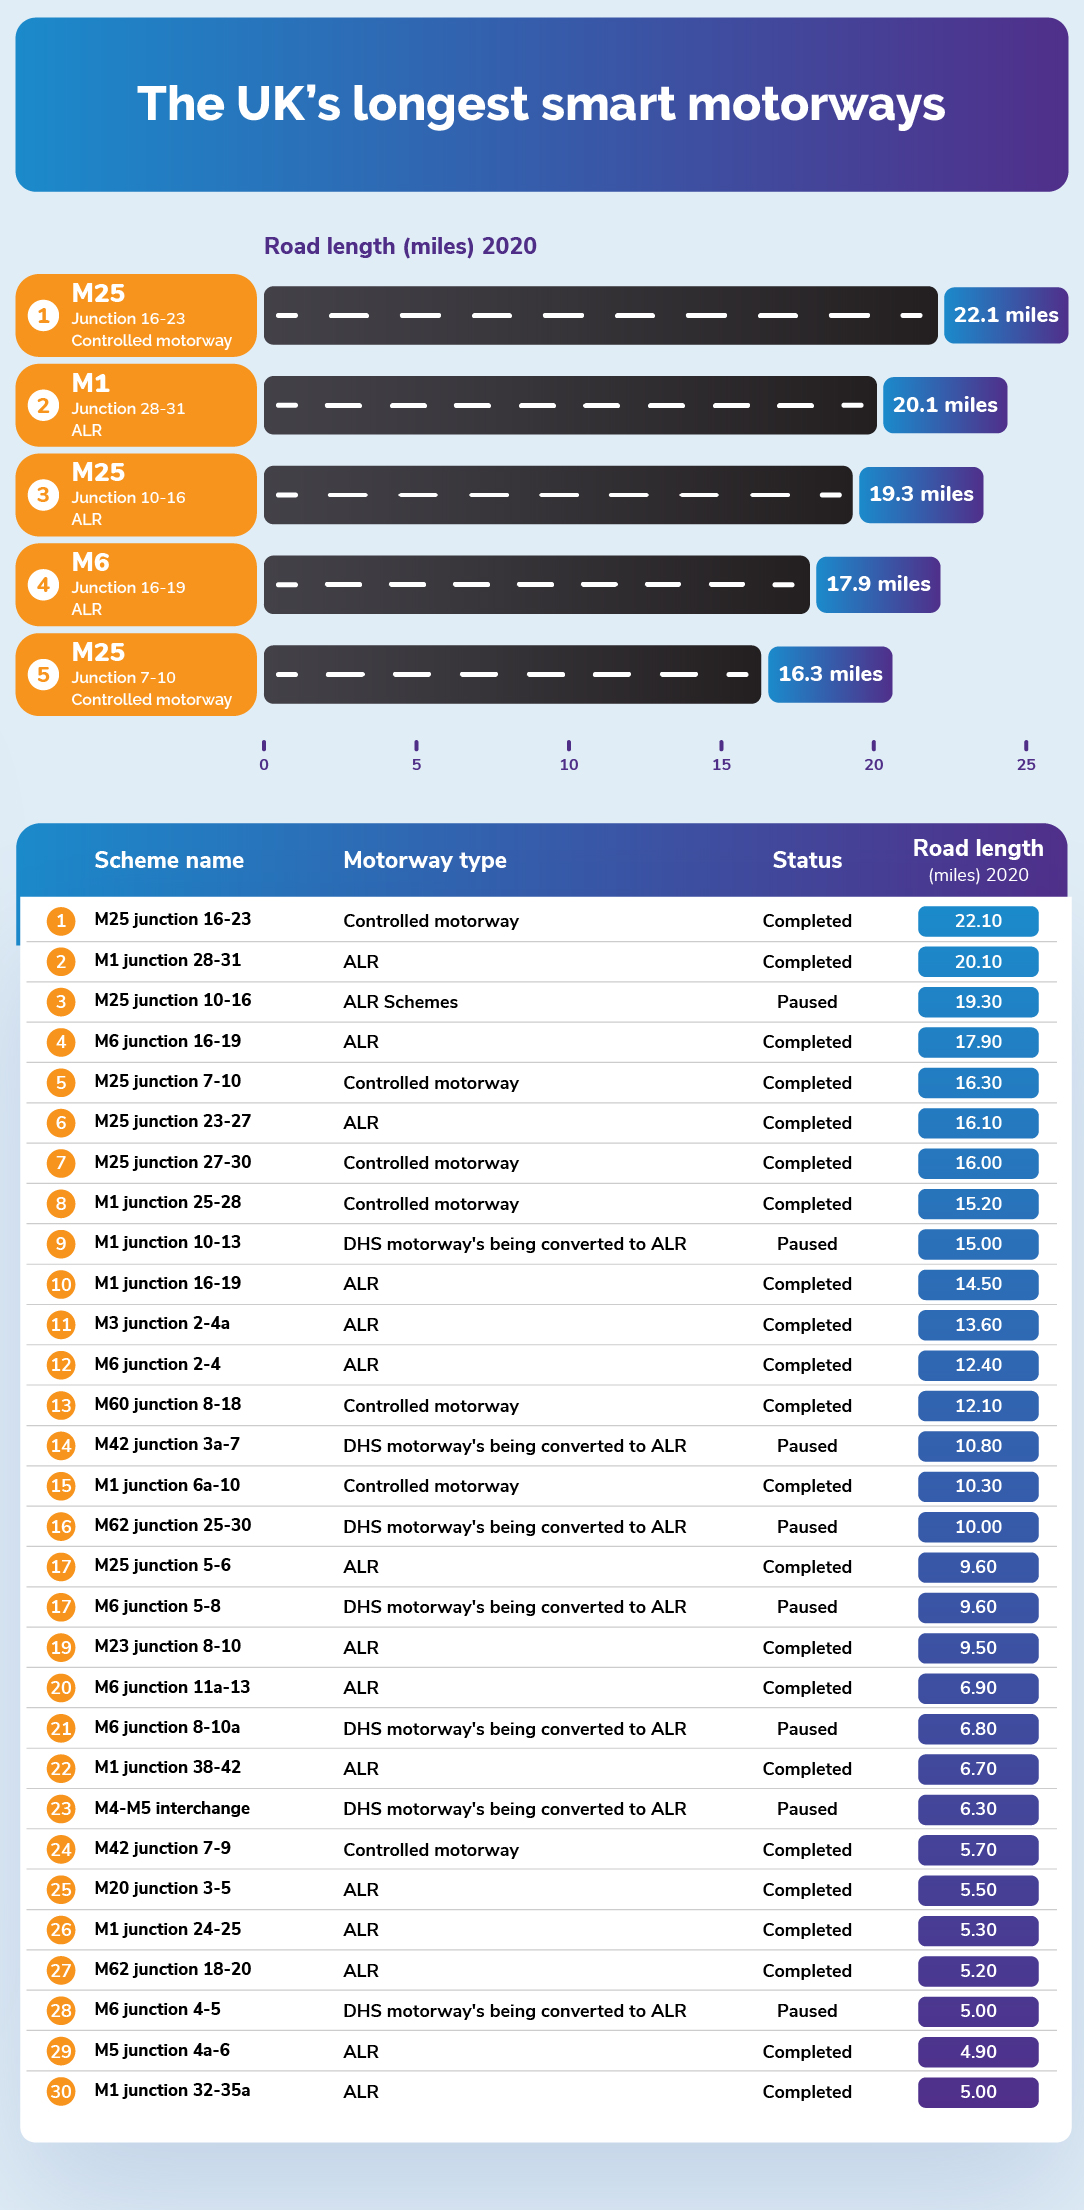
- M25 Junction 16-23 – Controlled Motorway
Road Status: Completed | Road Length (Miles) 2020: 22.1 miles
The longest stretch of smart motorway in the UK is the M25 junction 16-23, which is a controlled motorway and therefore one of the older types, with ALRs being the newest. The road is completed and fully open and as of 2020, it measured 22.1 miles long.
- M1 Junction 28-31 – ALR
Road Status: Completed | Road Length (Miles) 2020: 20.1 miles
This stretch of motorway runs from Alfreton all the way to Aston, near Rotherham. It is an ALR and as such one of the newest smart motorways, having been opened for traffic as an ALR since March 2016. As of 2020, it is recorded as 20.1 miles long.
- M25 Junction 10-16 – ALR Schemes
Road Status: Paused | Road Length (Miles) 2020: 19.3 miles
This junction is due to be upgraded to an ALR motorway, however, this plan has been paused, despite how large this section of motorway is. Work was expected to commence on this junction during Spring 2022, as per the last update in April 2021. This motorway is 19.3 miles long, as of 2020.
- M6 Junction 16-19 – ALR
Road Status: Completed | Road Length (Miles) 2020: 17.9 miles
Improvements started on this motorway in 2019 to change it to an ALR motorway, finishing in the winter of 2021 and costing up to £66 million. This junction on the M6 is 17.9 miles long as of 2020.
- M25 Junction 7-10 – Controlled Motorway
Road Status: Completed | Road Length (Miles) 2020: 16.3 miles
And rounding out the top five, we have the M25 junction 7-10, which is a controlled motorway, the second of this type to feature in this top five. As of 2020, it is measured at 16.3 miles long and is the third piece of London’s M25 to feature here.
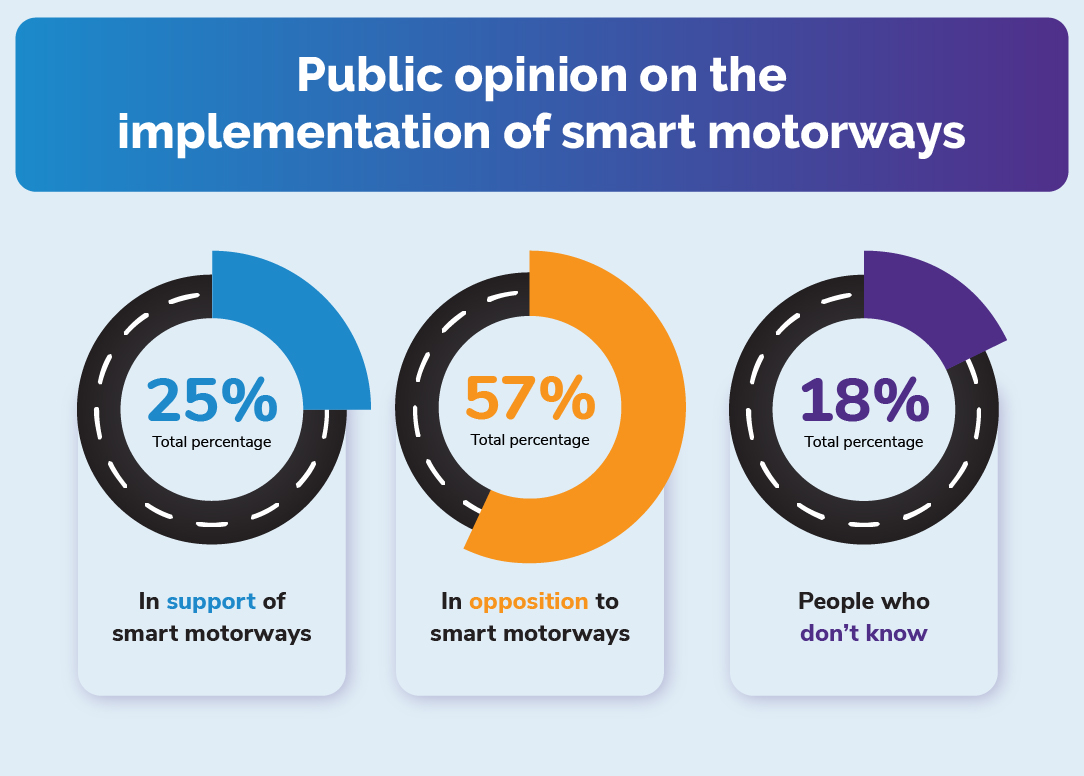
According to a YouGov poll taken in January of 2021, the public opinion on smart motorways is as dubious as that of National Highways and the Department for Transport and other governing bodies, as conversion and construction of such schemes have been halted.
This is due to a recommendation that more emergency areas need to be implemented as they are currently 1.55 miles apart in most cases. The target is to reduce this to a minimum of 0.93 miles and 0.62 miles where possible.
However, 57% of people who took the YouGov survey were in opposition to the implementation of the newest smart motorway, ALR, with just 25% in support of them and 18% responding that they didn’t know.
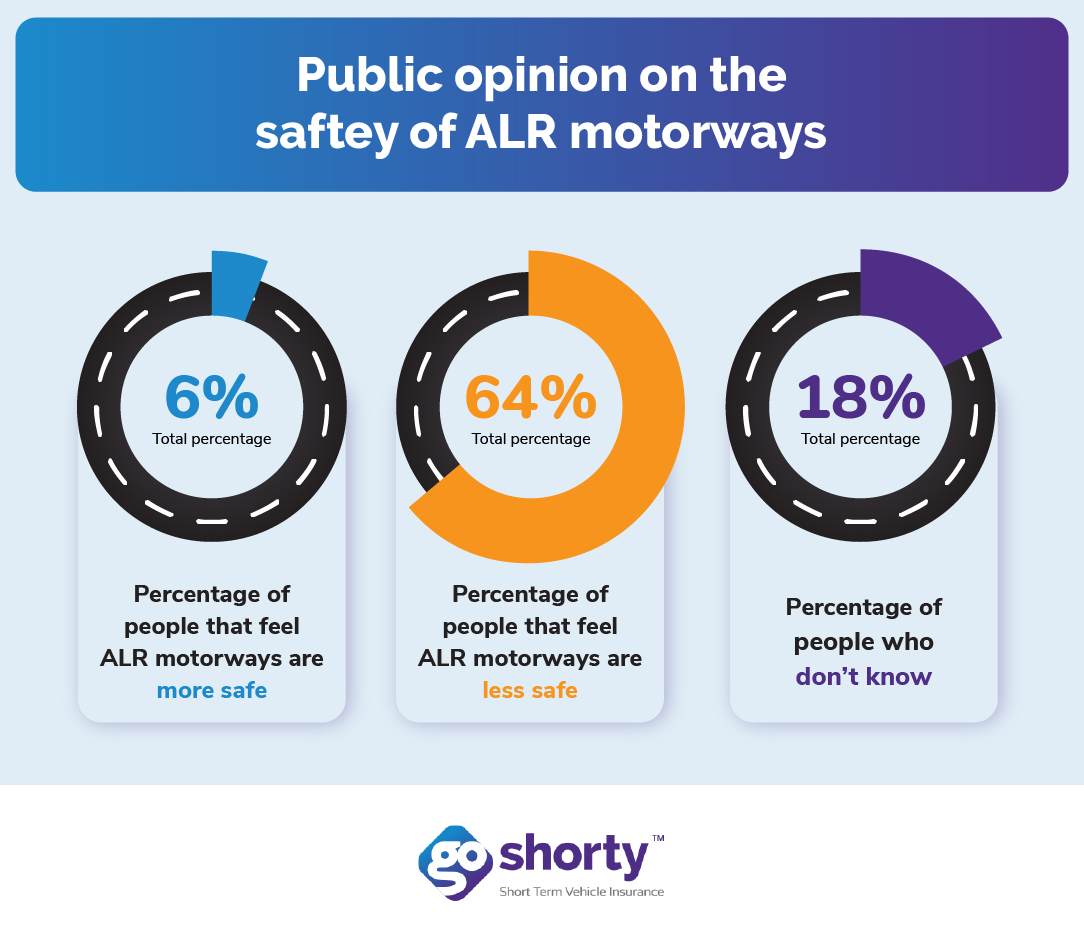
In regards to the public opinion of the safety of these roads, the results are not any better. Of the people surveyed, just 6% thought that ALR motorways would be safer than motorways with a traditional hard shoulder lane, as opposed to the overwhelming 64% who viewed them as less safe. And again, 18% of people responded that they didn’t know.
With that, it would seem that public opinion on the implementation of these roads is far from positive, as people feel they would be less safe for the most part. Seemingly, the majority of people would be much more content to remain using motorways with a dedicated hard shoulder lane.
Methodology –
To begin with, we used the National Highways report on smart motorways, to find out how many smart motorways there were, which were completed, under construction or paused, as well as how long they are and how much traffic they get. We then ranked the motorways on length as of 2020 and then on traffic, as an average from 2015-2020. Where data is blank for certain motorways, data was unavailable, presumably due to them being under construction or paused.
We then used a YouGov survey from January 2021, to get a sense of the public opinion on the reliability, implementation and safety of smart motorways, specifically ALRs.
And finally, for road accidents and casualties, we sent out an FOI request, which specified accidents by road type between 2015 and 2020, we then tallied up the number of accidents each road type had during this time. From there, we used Government data to get the total amount of miles of A-roads in the UK. For conventional, ALR, DHS and controlled motorways, we used the aforementioned National Highways report to calculate the number of total miles for each road in the UK. We then calculate how many accidents had taken place between 2015-2020 on each road type per mile of each type.